Statistics
The Statistics modal provides an overview of your booked hours across different time periods and projects. Open it by clicking the sidebar stats cards or the statistics button in the toolbar.
Slides
The modal has three tabs (slides) that you can switch between:
Overview
Shows week and month balance cards:
- This Week — total booked vs. target hours for Mon–Fri, with progress bar and percentage
- This Month — total booked vs. target hours for all working days in the selected month
Both cards include an "until yesterday" section that shows your balance for completed days only, so you can see whether you're ahead or behind without today's (potentially incomplete) hours.
Breakdown
Shows the distribution of your monthly hours:
- Billable vs. Non-billable — stacked bar with percentage and absolute hours
- Total hours and project count for the month
This slide only shows data from Moco entries.
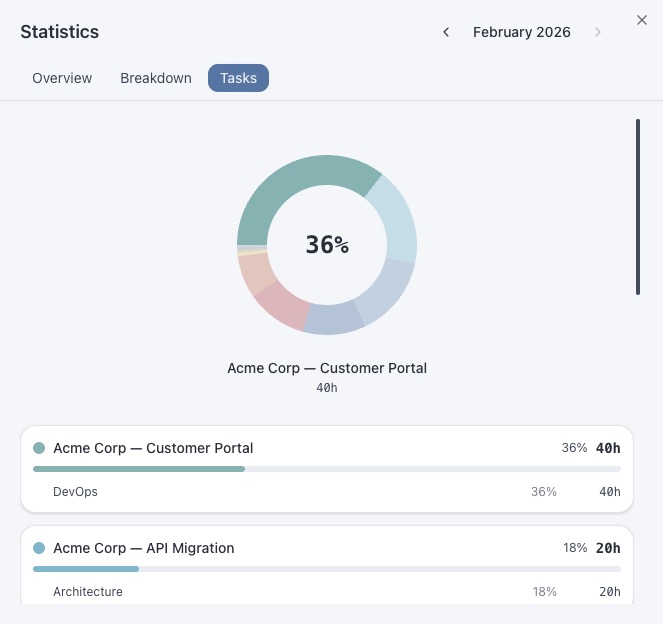
Tasks
A visual project distribution with:
- Donut chart — interactive pie chart showing time per project (hover for details)
- Project list — each project with its tasks, hours and percentage of total time
Projects are color-coded using the Nord palette and sorted by hours (highest first).
Month Navigation
Use the arrow buttons next to the title to navigate between months. The modal fetches data for the selected month on demand and caches it for fast subsequent access.
Year-to-Date Balance
The sidebar can show a year-to-date overtime balance. This fetches Moco data for all months from January to the current month (in batches of 3 to balance speed and API load).